
This post is an overview of code coverage metrics in .NET using Coverlet. In this post we'll:
- go through creating a simple solution containing two projects, one containing production code and one containing tests
- set up Coverlet and look at how coverage metrics are calculated
- see how metrics change when code is added, removed, or changed
- look at the different formats of reports
- see how code coverage history can be tracked
Overview #
Code coverage metrics are, as should be no surprise, a way of measuring how much of your code is covered by tests. Code coverage is a useful metric to help you gauge how much of your code is (or isn't) covered by tests. However, code coverage metrics are not a silver bullet, and should not be used as a measure of quality; you could have high coverage, but, if your tests are not testing the right things, then you can't rely on those tests. This is where Mutation Testing helps.
Mutation tests work by changing (mutating) the code you're testing; if your tests fail because of that, then the mutant has been caught, but if your tests still pass, then it shows there is a gap in what you're testing.
We won't go into mutation tests in this post, but just know that code coverage metrics are not an accurate measure of quality and that there are other tools that help provide reassurance that your tests are testing the right things.
Creating a simple solution #
You can follow along and create this simple solution, or just skim through and read the findings.
We'll need a simple solution to work with; it will have a type to test and a test project. So, in a terminal window, create a new folder named CodeCoverageDemo. In that folder, run:
dotnet new solution
This will will create CodeCoverageDemo.sln.
Next, add a class library project named BusinessThing to the solution:
dotnet new classlib -n BusinessThing
Next, create an xUnit test project:
dotnet new xunit -n UnitTests
Now add those projects to the solution:
dotnet sln add BusinessThing/BusinessThing.csproj
dotnet sln add UnitTests/UnitTests.csproj
We now have a solution with a type to test and a test project.
Note that when you created the test project, it automatically referenced coverlet.collector, as can be seen in the project file:
<PackageReference Include="coverlet.collector" Version="3.2.0"... />This is because Coverlet is the default coverage tool for every .NET Core and .NET 5+ test applications.
Next, add the following code to the BusinessThing project:
public class Calculator
{
    public int Add(int n1, int n2) => n1 + n2;
    public int Subtract(int n1, int n2) => n1 - n2;
}
Now, let's add a test for the behaviour of adding two numbers (and add a reference to BusinessThing):
public class CalculatorTests
{
    [Fact]
    public void Adding_two_and_three_equals_five()
    {
        var sut = new Calculator();
        var result = sut.Add(2, 3);
        Assert.Equal(5, result);
    }
}
Now, let's run the test (initially, without coverage):
dotnet test
It should compile and run the tests without error.
Before we run code coverage, we need to know that there are three ways to run Coverlet (named 'drivers' on their documentation page)
- VSTest engine integration
- MSBuild task integration
- as a .NET Global tool (supports standalone integration tests)
Note: VSTest is a testing framework and platform and is the test runner for all .NET testing frameworks, including MSTest, NUNit, and xUnit. It's both a command line and an API. It interacts with 'collectors' for instance, for code coverage. Coverlet is one of those collectors.
The difference between VSTest and MSBuild, is that VSTest uses 'Data Collectors'; the data collectors in Coverlet are provided information on your code when the code runs as part of the tests, and it builds up the information it needs to report coverage. MSBuild, on the other hand, is a build task that instruments the code.
For this to work, we'll use the VSTest engine integration, which requires:
- .NET Core SDK v2.2.401 or newer
- a reference to version 16.5.0 or above of Microsoft.NET.Test.Sdk
Let's run the coverage!
dotnet test --collect:"XPlat Code Coverage"XPlat Code Coverage is the friendly name for Coverlet. If you change it, you'll get an error along the lines of Could not find collector 'Something else entirely'
Anyway, this should have created a report in a sub-folder. For me it was: C:\git\CodeCoverageDemo\UnitTests\TestResults\dd47b7da-8af7-4749-b927-17176e2d62f0\coverage.cobertura.xml
The report that it created is an XML report (we'll see in a bit how these files are generated into HTML reports). You might be wondering what "Cobertura" is? As well as being Spanish for 'Coverage', it's also a Java coverage tool and a standard file format for describing code coverage.
However, there are other formats. For .NET, the most common format is OpenCover and that's what we'll be looking at from now on.
To get an OpenCover report, we need to tell Coverlet. Change the previous command line to:
dotnet test --collect:"XPlat Code Coverage;Format=opencover
Let's take a look at the simplified XML below (which is simplified for brevity):
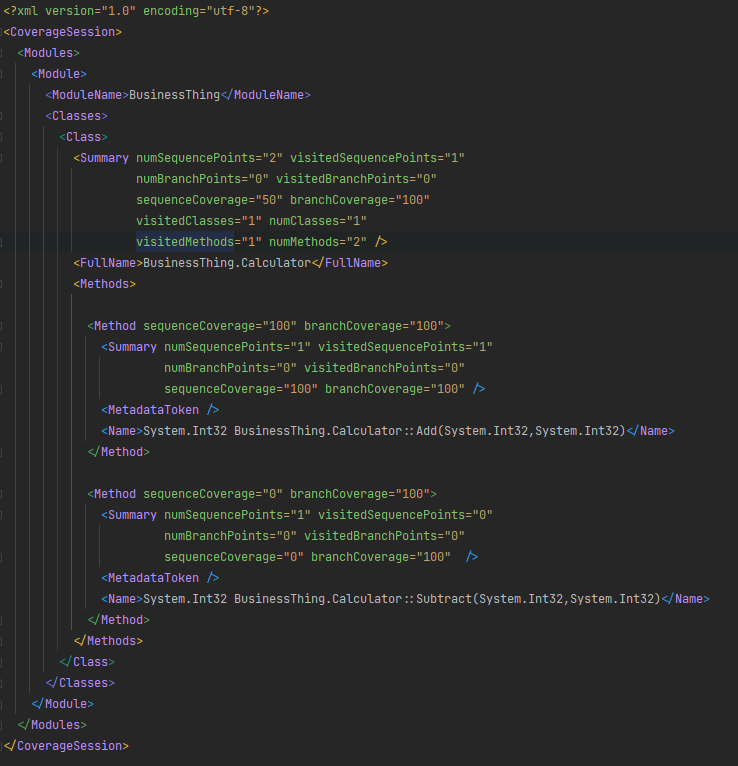
SequencePoints- the report is saying that there's 2 at the class level; 1 for each method (AddandSubtract)SequenceCoverage- at the class level, this is50as we've tested 50% of the class. At the method level,Addis100, as we've tested all of it, andSubtractis0as we've tested none of itBranchPoints- these are all0; we don't have any branches - we'll test this out in a bit
As you'd expect, if we now add a test for the Subtract functionality, then we'll be 100% covered. Let's do that now:
[Fact]
public void Subtracting_three_minus_two_equals_one()
{
var sut = new Calculator();
var result = sut.Subtract(3, 2);
Assert.Equal(1, result);
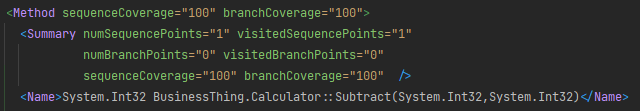
}Now, let's run the tests and coverage again. Open up the generated XML file (remember, it'll be in a different folder this time). The differences are:
- the summary at the top now says that all sequence points have been visited:
<Summary numSequencePoints="2" visitedSequencePoints="2" sequenceCoverage="100"/> - the summary for the class (
Calculator) now says that all sequence points have been visited - the node for the
Subtractmethod now shows:
Next up is branching. If we change Subtract to be:
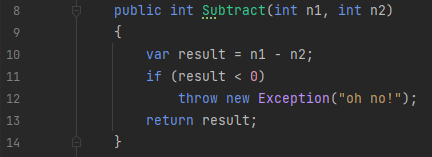
... and we run coverage again, because we haven't yet tested the negative number behaviour, coverage drops:
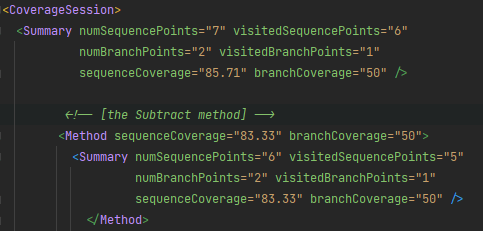
The 83% equates to the 5 out of 6 sequence points visited.
Also, we now see in the report that BranchCoverage="50". That's to be expected as we've only exercised half of the branches.
Let's up our code coverage by writing a unit test to cover this branch:
[Fact]
public void Subtracting_to_a_negative_number_throws()
{
    var sut = new Calculator();
    Assert.Throws<Exception>(() => sut.Subtract(3, 4));
}
Run the coverage again. The report now says this for the Subtract method:
<Method sequenceCoverage="100" branchCoverage="100" >
  <Summary numSequencePoints="6" visitedSequencePoints="6"
           numBranchPoints="2" visitedBranchPoints="2"
           sequenceCoverage="100" branchCoverage="100"  />
So far, the code has been 100% unit-testable. Let's look at the scenario where that's not the case.
Ignoring code #
There's some code that cannot be reasonably unit tested. For these cases, we can decorate the code with an attribute to say that it shouldn't be part of the coverage stats. Take the follow hard to test type:
public class MyHttpClient
{
    public string GetSomethingFrom(string url)
    {
        using var client = new HttpClient();
        var response = client.GetAsync(url).Result;
        return response.Content.ReadAsStringAsync().Result;
    }
}
It's difficult to unit test and, without the attribute, our coverage goes down. Run coverage again now to see this:
<CoverageSession>
  <Summary numSequencePoints="12" visitedSequencePoints="7"
           sequenceCoverage="58.33" ...
Adding the ExcludeFromCoverage attribute (in System.Diagnostics.CodeAnalysis) onto the class effectively hides this type and brings the coverage back up:
[ExcludeFromCodeCoverage]
public class MyHttpClient ...
This attribute can also be applied to methods for more fine-grained exclusions. It's also possible to specify what to exclude from the command line, although considering how easy it is to use the attribute, they seem like the default choice.
Pretty reports! #
So far we've strained our eyes reading formats meant for machines. Lets generate a report designed for humans; an HTML report.
For this, we'll use another tool called ReportGenerator. ReportGenerator will turn OpenCover files into HTML.
There are a few ways to run it which are described in their Getting Started page. For this post, we'll be installing it as a dotnet global tool with:
dotnet tool install --global dotnet-reportgenerator-globaltool
To use it, we need add this package to the test project:
<PackageReference Include="ReportGenerator" Version="5.1.23" />
If you've been following along with the code, remove the ExcludeFromCodeCoverage so that we can get a report that shows both covered and uncovered code.
Now run coverage once more to generate a new OpenCover report.
Then run ReportGenerator to turn that into HTML with:
reportgenerator "-reports:UnitTests/TestResults/*/coverage.opencover.xml" "-targetdir:coveragereport" -reporttypes:Html
This produces the following report:
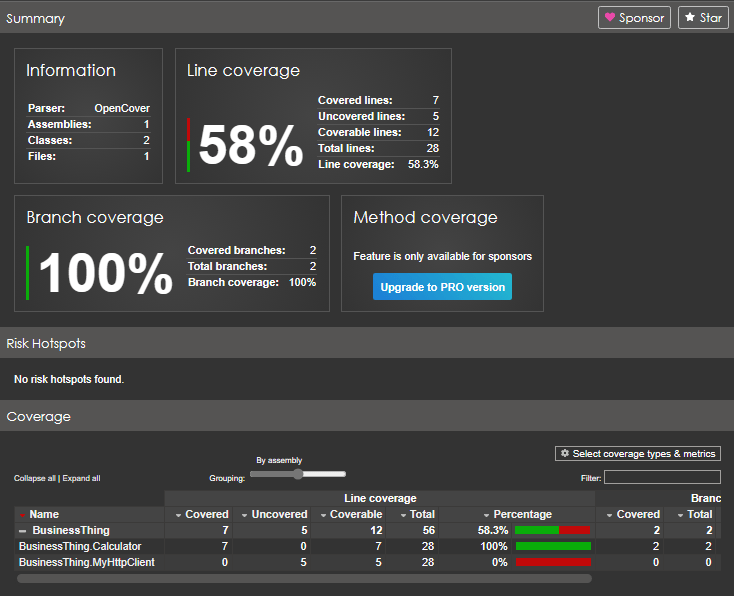
It matches the data in the XML report but is much easier on the eyes!
Coverage history #
The reports we've been generating are a snapshot in time. But ReportGenerator can also store and report on the history of code coverage. Let's try it.
We want to remove all previous reports and get the project into a state where we have 100% coverage, so:
- reinstate the
CoverageExccludeback onMyHttpClient - clear all previous reports by deleting all folder under
TestResults - run another XML code coverage report as before
- run ReportGenerator, but this time use:
reportgenerator "-reports:UnitTests/TestResults/*/coverage.opencover.xml" "-targetdir:coveragereport" "-historydir:history" -reporttypes:Html
Notice the "-historydir:history. As well as the usual HTML report, it now stores an XML file under the history folder. Filenames are timestamped, e.g.2023-07-22_18-35-06_CoverageHistory.xml
Let's take a look at the contents:
<?xml version="1.0" encoding="utf-8" standalone="yes"?>
<coverage version="1.0" date="2023-07-22_18-35-06" tag="">
  <assembly name="BusinessThing">
    <class name="BusinessThing.Calculator"
           coveredlines="7" coverablelines="7"
           totallines="29" coveredbranches="2"
           totalbranches="2" coveredcodeelements="2"
           totalcodeelements="2" />
  </assembly>
</coverage>
... notice that MyHttpClient is missing. This is because of the coverage exclude attribute. To have it as part of the report, remove the CoverageExclude attribute, run the OpenCover report, and run the CodeGenerator report. This drops another file in the history folder:
<?xml version="1.0" encoding="utf-8" standalone="yes"?>
<coverage version="1.0" date="2023-07-22_18-36-29" tag="">
  <assembly name="BusinessThing">
    <class name="BusinessThing.Calculator"
           coveredlines="7" coverablelines="7"
           totallines="28" coveredbranches="2"
           totalbranches="2" coveredcodeelements="2"
           totalcodeelements="2" />
    <class name="BusinessThing.MyHttpClient"
           coveredlines="0" coverablelines="5"
           totallines="28" coveredbranches="0"
           totalbranches="0" coveredcodeelements="0"
           totalcodeelements="1" />
  </assembly>
</coverage>
As expected, there's no difference for Calculator, but we can now see MyHttpClient (and we can see it is woefully uncovered!)
Let's now look at the HTML report that was generated:
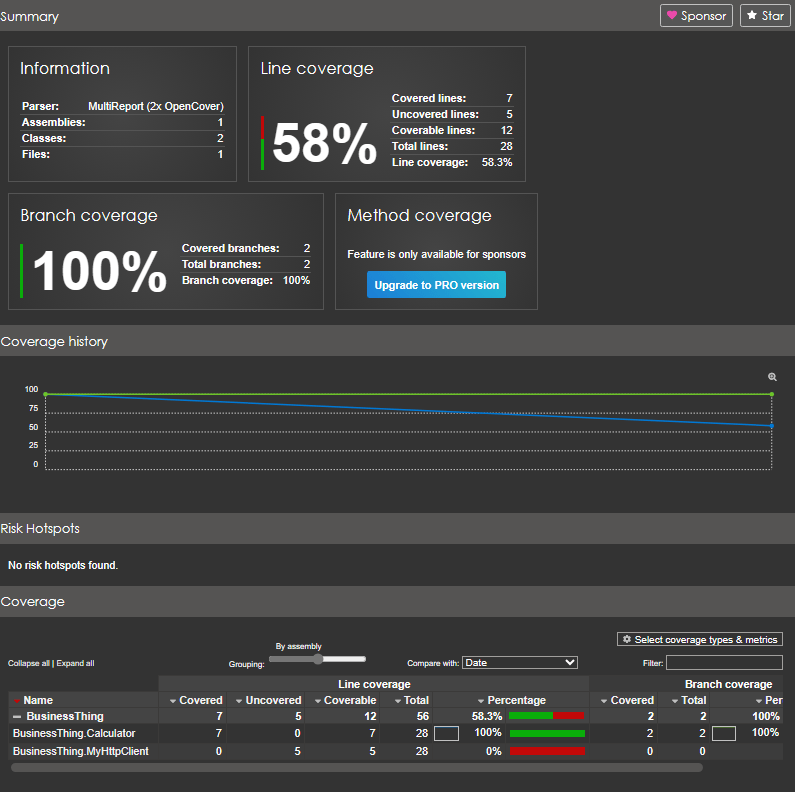
We can now see coverage history.
What next? #
It's common for metrics such as code coverage to be part of your Continuous Integration (CI) pipeline, such as TeamCity or GitHub actions. We won't go into it here, but it's possible to set build conditions on certain metrics. Now that we have code coverage history, we could fail the build if it drops.
Summary #
We've seen how to set up and run the tools required to generate and report coverage data.
We've seen how these tools interact. We can now go on to include coverage as part of a CI pipeline.
One last thing to reiterate is that code coverage metrics aren't a gauge of the quality of your software; you could have high coverage but still have bugs.
Also, introducing code coverage as a target isn't necessarily helpful as you will eventually get diminishing returns, for instance, certain branches through the code will be incredibly difficult (if not impossible) to unit test.
So while code coverage is a valuable metric, it should be used as part of a balanced set of software quality metrics, including things such as complexity of the code, areas of duplication, conformity to best practices and standards (i.e. analysers), and others.
What do you think of code coverage? Personally, I see it as a somewhat useful metric when combined with other metrics. If nothing else, it is useful as a mechanism to fail the build if new code is added without associated tests.
testing dotnet🙏🙏🙏
Since you've made it this far, sharing this article on your favorite social media network would be highly appreciated 💖! For feedback, please 🦋 ping me on Bluesky! 🦋
Leave a comment
Comments are moderated, so there may be a short delays before you see it.
Published